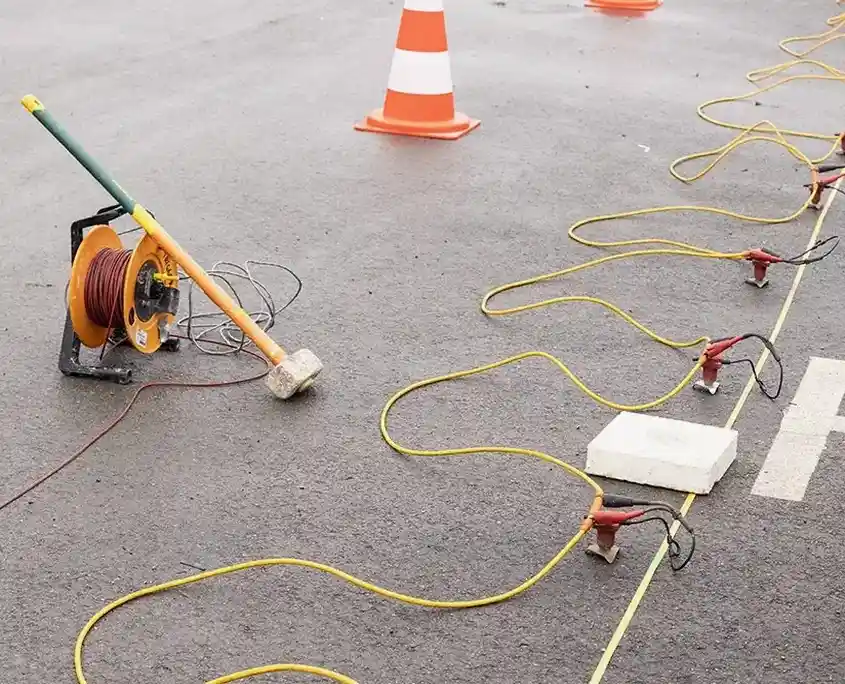
A contractor called us last fall, frustrated. They'd hit an unmapped buried valley off East Market Street. The borehole showed competent soil, but twenty feet over, the auger dropped into soft organics. That's Akron. The glacial history here left a mess of buried valleys, shale benches, and erratic till. Seismic tomography cuts through that. We lay out a geophone spread, generate a shot, and map the velocity contrasts in real time. The P-wave and S-wave data show where the till transitions to shale, where the water table sits, and whether you're dealing with rock or just a dense lodgement. For Akron's uneven stratigraphy, seismic refraction gives us a continuous line of evidence, not just a point. And when the target depth exceeds 100 feet, we combine it with MASW to tie the shear-wave profile directly to IBC site class. It's the difference between a bid that bleeds money and one that matches the ground.
In Akron's buried valleys, the top-of-rock can vary 30 feet across a building footprint. Tomography catches the slope before the excavator does.
Our approach and scope
Local geotechnical context
Akron's freeze-thaw cycles, with winter lows hitting -10°F on record, work the upper weathered zone hard. Come spring, the saturated till above a shallow shale bench can mask the true bedrock velocity during a refraction survey. We run the lines after a dry spell when we can, or use reflection profiling to get beneath the low-velocity cap. The bigger risk is assuming the bedrock surface is planar. In the Merriman Valley and along the Little Cuyahoga, the paleotopography has steep-walled channels filled with soft lacustrine sediments. A foundation designed on one borehole's rock elevation might be perched on a remnant block with 15 feet of compressible fill under the adjacent footing. Differential settlement shows up years later. We overlay the velocity model onto the site plan and flag every gradient steeper than 20%. That's where the real money gets spent. For sites with suspected voids in the Sharon, cross-hole tomography or a targeted resistivity line can confirm the anomaly before drilling.
Regulatory framework
ASTM D5777-18 (Seismic Refraction for Subsurface Investigation), ASTM D7128-18 (Seismic Reflection), ASCE 7-22 Chapter 20 (Site Classification using Vs), ODOT CMS 405 (Geophysical Exploration)
Related services
Seismic Refraction Profiling
P-wave and S-wave refraction surveys using 24- or 48-channel arrays. We deliver 2D velocity cross-sections with interpreted top-of-rock, water table, and rippability zones per Caterpillar D9R charts.
Seismic Reflection Surveys
For depths beyond 100 ft or where velocity inversions mask the bedrock. We use common-midpoint (CMP) stacking to image the Sharon Conglomerate and deeper Pottsville strata under buried valleys.
MASW and Vs Profiling
Active and passive surface-wave methods to measure shear-wave velocity in the upper 100 ft. Used directly for IBC site classification (A through F) and liquefaction screening in the Cuyahoga floodplain.
Typical parameters
Questions and answers
How deep can seismic refraction see in Akron's glacial terrain?
With a standard 230-foot spread and a sledgehammer source, we typically image to about 80 to 100 feet. Using a weight drop or accelerated weight drop extends that to 150 feet. In the buried valleys north of downtown, where soft fill overlies deep till, reflection methods may be needed to reach 200 feet or more to map the Pottsville bedrock.
Can tomography distinguish between shale and sandstone?
Yes, usually. The Pottsville Formation shales and interbedded sandstones have distinct velocity ranges. Competent Sharon sandstone typically shows P-wave velocities above 8,500 ft/s, while the shale members run 6,500 to 9,000 ft/s depending on fracturing. The tomogram's velocity gradients highlight the contact where the contrast is sharp. We ground-truth the interpretation against available ODOC boring logs.
What does a seismic tomography survey cost for a typical Akron building site?
For a standard commercial lot with two to three 230-foot refraction lines, the cost typically falls between US$2,580 and US$5,900. The range depends on the number of spreads, the source type needed to get adequate depth, and whether MASW is added for site classification. A mobilization charge applies for sites outside the immediate Akron area.
How do you handle sites with asphalt or concrete cover?
We drill small holes through the pavement to plant the geophones directly into the soil or use baseplate-mounted geophones on clean concrete. The asphalt doesn't stop the survey, but it does require flagging and traffic control if we're in an active parking lot. We coordinate that with the site manager ahead of time.